September 8, 2014
I have finally gotten some of my rarefaction data completed. Interestingly, the only significant differences are between Wild vs. Commercial and 2010 vs. 2011 restoration. Commercial and 2010 both having significantly higher allelic richness than their counterparts.
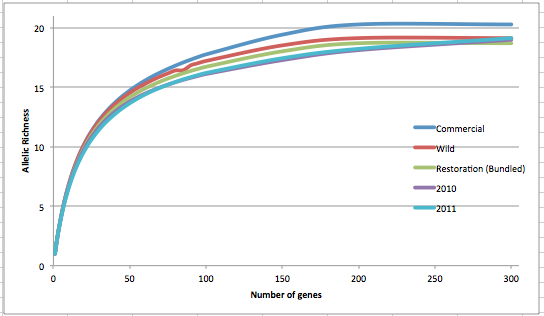
This is my attempt at a rarefaction curve for all of the data. In my presentation, I will likely show something like this except with only Wild as a solid line and points for the other components. -- All significance testing used a Wilcoxon paired-sample test at number of genes = 93. All were 1 tailed except for the 2010 vs 2011. Also, I used the differences between each locus for these tests.
August 29, 2014
I have been working on organizing and figuring out my talk for NSA today!
August 26, 2014
I am creating a random sample (n=96) of the restoration oysters to use for analysis in GenePop and HPrare.
I have done this by taking 2 random individuals from each family. With 3 additional random individuals from both years.
I have chosen the individuals in excel by putting a random number from 0-1 next to each individual within a family (using the rand() function) and taking the 2 highest numbers,
For the additional 8, I put a random number next to all of the individuals, sorted it and took the highest four individuals from each year that weren't already selected.
August 5, 2014
Colony is still running with the Wild data. I checked to make sure today that the error rates that I entered into the program are correct.
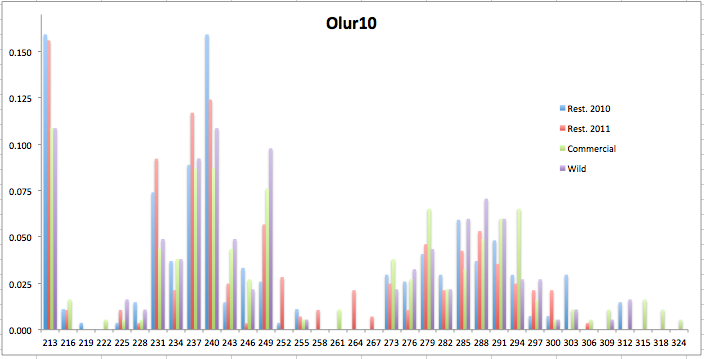
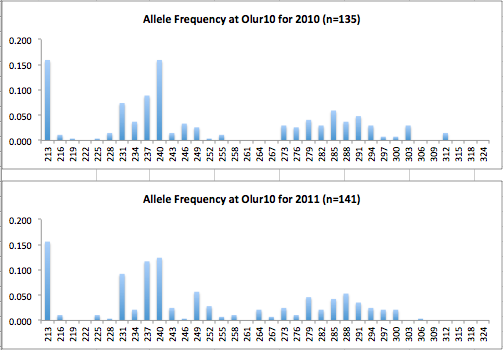
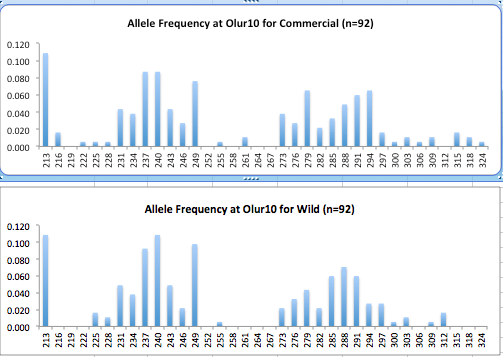
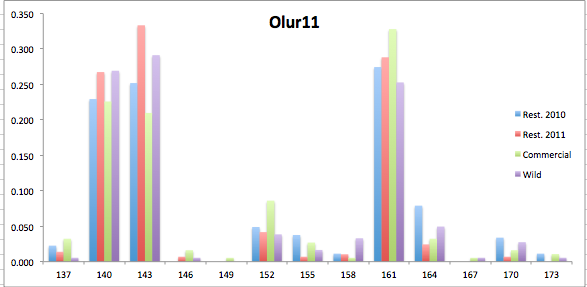
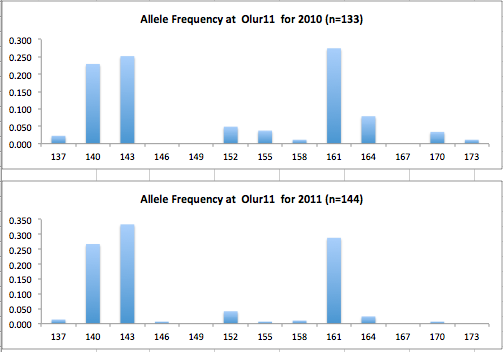
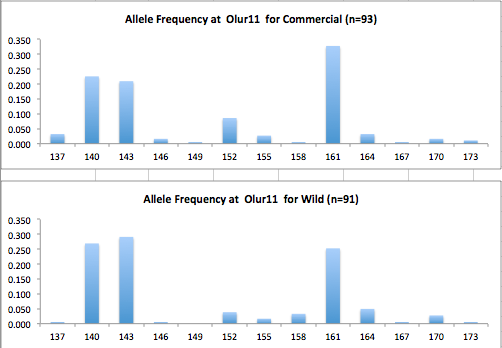
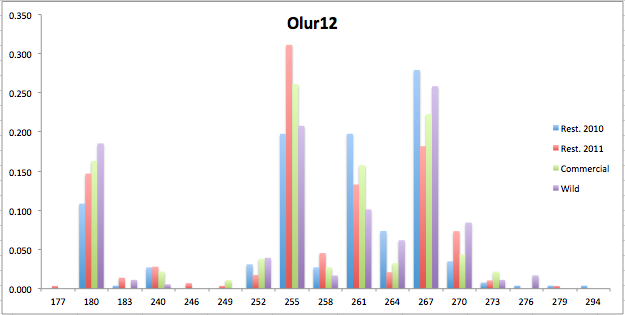
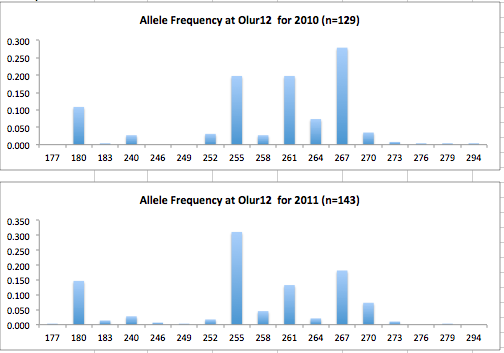
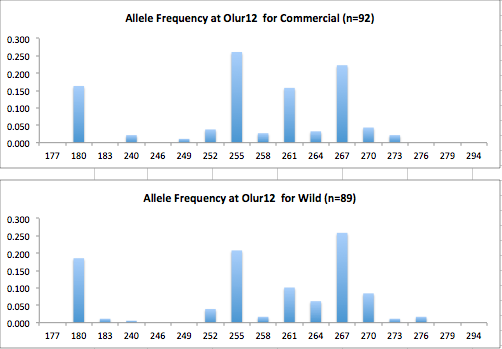
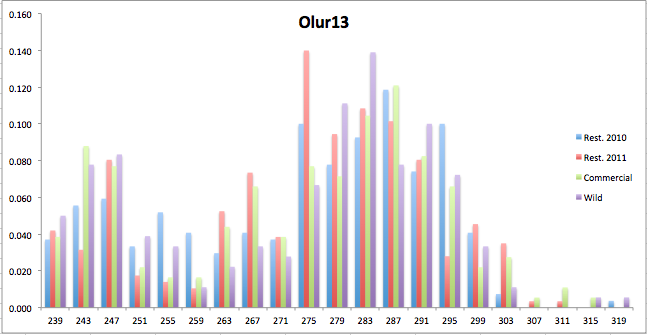
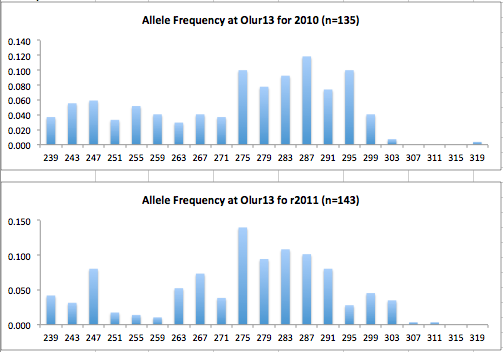
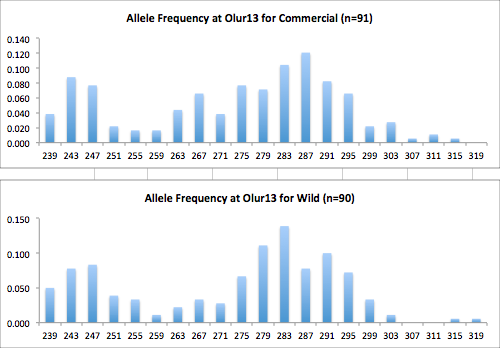
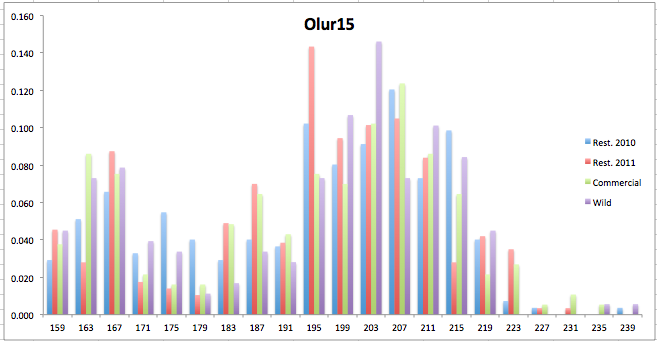
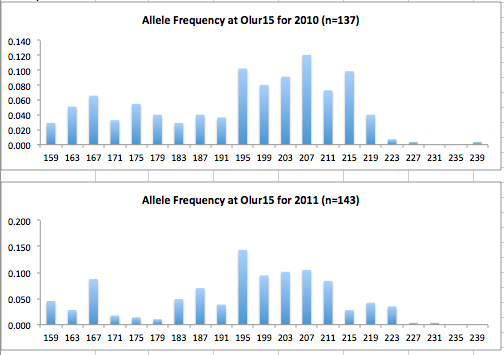
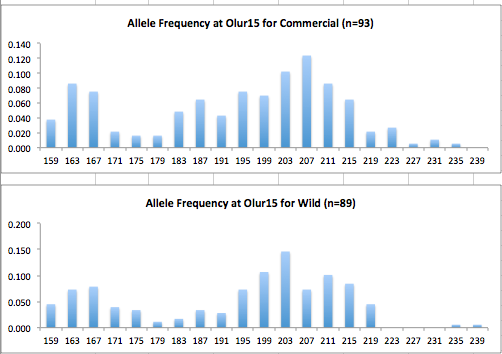
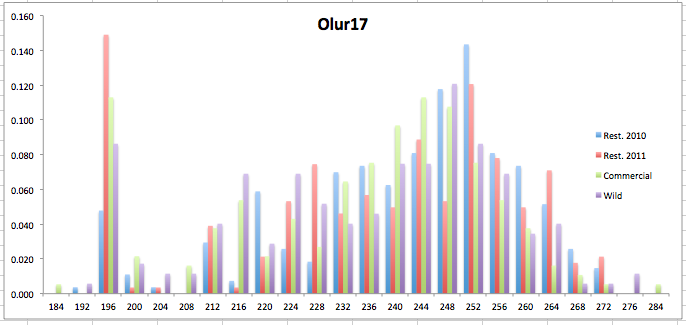
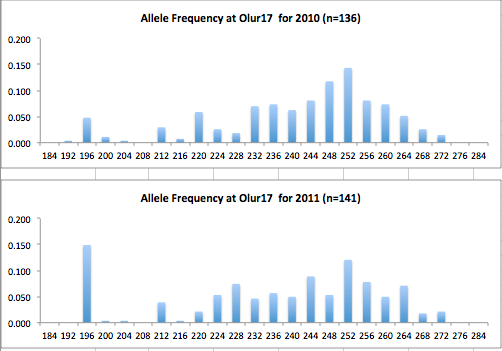
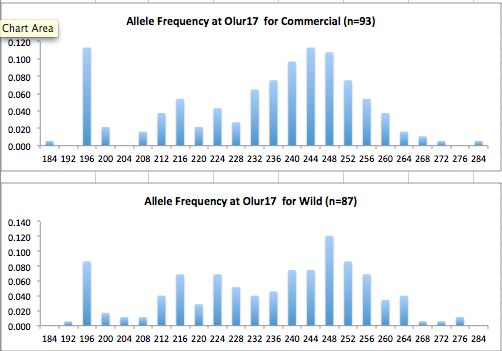
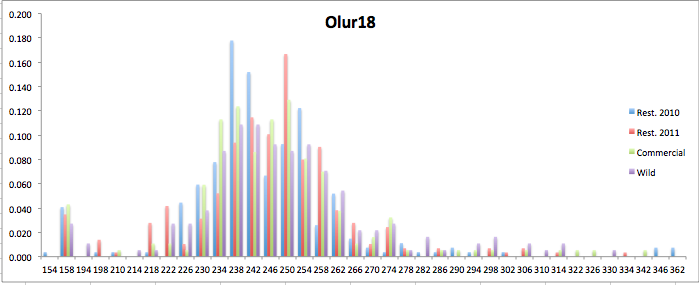
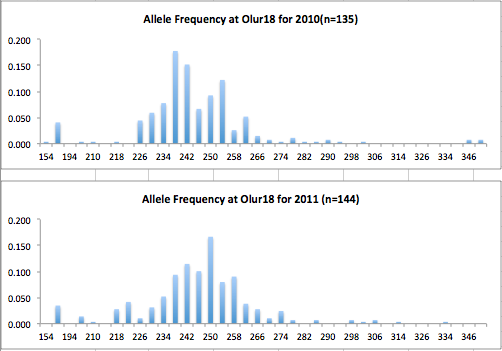
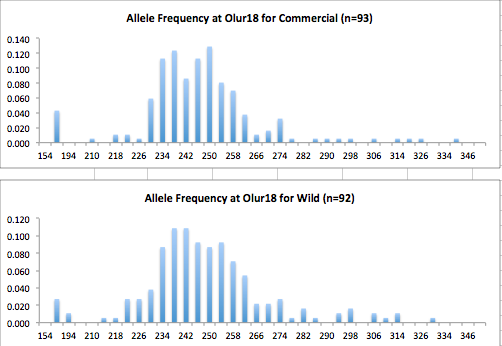
Here are the allele frequency histograms that I got out of GenAlEx. Both restoration populations include all of the data that I have for them (The old and new plates).
August 1, 2014
Yesterday afternoon, Crystal sent me the data for the Wild plate. I have ran everything through Tandem together to confirm that the controls are the same in each plate. They are.
I have started running the wild data through Colony, I don't think it will be done by the time I have to leave today.
I also ran all of the data (as 4 separate populations) through GenAlEx to produce allele frequencies. GenAlEx also produces Fst, Ho, He, uHe, and Fis. I'm not sure if this is the best program to use for these values. I will have to look into it.
July 21, 2014
I went to Manchester today to complete the DNA extraction of the Wild plate with Crystal.
We got DNA from all of the samples. Crystal says she should get the data from this plate to me soon!
July 19, 2014
First -- I wish I was at the BBQ right now...
Second -- I reran the rounding software (Tandem) on all of my microsatellite data together. I will still need to repeat this after I get the data from the final (Wild) plate.
But, I do have concrete proof that I found the missing control sample in the commercial plate.
Sample 399 (from the restoration plate) is a perfect match to sample 10B from the commercial plate. I think I accidentally rotated the multichannel pipettor (sp?) during some stage of the DNA extraction.
July 18, 2014
I was planning on going to Manchester today, but Crystal had to cancel. I am going on Monday instead.
Also, my first set of Colony data (All of the restoration 2010 samples) is complete, but I will have to rerun it after I repeat the rounding software on all of the samples together.
July 11, 2014
I combined all of the 2011 and all of the 2010 raw data into new files and ran Tandem on them. I have started the Colony run on the total 2010 data.
I chose "high" precision and I also selected to complete 2 runs. I think that might increase my confidence in the results and remove things with a 1% probability (for example).
Originally, I was planning on taking ~4 (out of 10) individuals from each of the families from the first plate and combining it with all of the data from the second plate (since I only had ~4 samples from each of the remaining families). I decided to just run all of the data together, even though the families will be different sizes (half will have n=10 and the other half will have n=4) I think it is better to just use everything I have. I will be able to repeat the run with a different configuration of samples if this isn't the best/most accurate way to do this.
Also, I chose to start with the raw data and rerun Tandem, because I am not completely sure exactly how Tandem works, especially if it relies on the rest of the data in the file for rounding.
All of my microsat data can be found here
All of my previous microsatellite analysis is in here too, but the files that will be important are:
- Commercial
- Restoration - 2010 Total
- Restoration - 2011 Total
July 9, 2014
I removed the samples from the water bath today. They looked much better than yesterday. Also, the water bath held temperature overnight. It was at 60 degrees, which is a little high, but I think the samples should be okay. They are currently in the -20 degree freezer.
July 8, 2014
At about 1:45 I removed the samples from the water bath and resealed the lids. Again, I found that the water bath was at 25 degrees when I came back in. This time, the water bath was still turned on with the dial set to 56, but the safety light was turned on and the temperature was down. Even when I moved the dial higher or unplugged the whole water bath I couldn't get it to start heating.
The samples did not look fully digested because there were many tubes that were extremely cloudy and dark and some with pieces of tissue still in them.
I decided to incubate them for another night. This time, I put them into the smaller water bath that was already turned on and set at 37 degrees. I put the temperature up and added some water. I am keeping my fingers crossed that this one will work!
Also, I heard back from Crystal this morning. She isn't available this week for me to come in and work on my samples. I am going to go to Manchester next Friday. She also sent me the raw data from the two plates she already completed so I should be able to get working on my analysis.
Olur microsats_Comm and Rest.xlsx <-- The raw data for the commercial and remaining restoration samples!
July 7, 2014
I 180uL buffer ATL and 20uL Proteinase k to the wild samples and started incubating them at 56 degrees.
I met with Brent to discuss plans for finally writing the anesthesia paper. My goal for this week is to have a draft introduction finished. I will start working on it tomorrow (Tuesday) afternoon.
June 27, 2014
I dissected and cut samples of 96 wild Oly's for the wild plate of my capstone. Brent shucked the oysters, I cut the samples, and Steven kept everything organized. We took extra samples of each of the animals and stored them with ethanol at room temperature. We kept the shells and they are still drying out on the bench in Brent's office.
Individual 399, the control, was placed into the final well (H12) and was marked as 96 to make it a blind control.
| 1 |
2 |
3 |
4 |
5 |
6 |
7 |
8 |
9 |
10 |
11 |
12 |
|
| A |
1 |
2 |
3 |
4 |
5 |
6 |
7 |
8 |
9 |
10 |
11 |
12 |
| B |
13 |
14 |
15 |
16 |
17 |
18 |
19 |
20 |
21 |
22 |
23 |
24 |
| C |
25 |
26 |
27 |
28 |
29 |
30 |
31 |
32 |
33 |
34 |
35 |
36 |
| D |
37 |
38 |
39 |
40^ |
41^ |
42 |
43 |
44 |
45 |
46 |
47 |
48 |
| E |
49 |
50 |
51 |
52 |
53 |
54 |
55 |
56 |
57 |
58 |
59 |
60 |
| F |
61 |
62 |
63 |
64 |
65 |
66 |
67 |
68 |
69 |
70 |
71 |
72# |
| G |
73# |
74# |
75# |
76# |
77# |
78 |
79 |
80 |
81 |
82 |
83 |
84 |
| H |
85 |
86 |
87 |
88 |
89 |
90 |
91 |
92 |
93 |
94 |
95 |
96* |
- = control (really restoration 399)
- = all of these animals were taken off of one shell and had all settled very closely together. They were also all approximately the same size.
June 16, 2014
I went to Manchester today to observe the final steps of processing the microsat samples. I took the samples out of the PCR and added the dye/size standard (I think this is what they were called) to each of the samples. We used 500Liz. After this, we brought the samples to the sequencer and started running the plates. Finally, Crystal showed me the allele calling step. She told me that she deletes all of the samples with multiple peaks. I should get this data soon.
There was one (fairly major problem), the control (individual 399) was loaded onto both plates and went through all of the stages (including DNA extraction) separately. So far, only 4 loci had been completed, but the two controls were not matching. I am going to wait for the final data to try and see what happened there. Also, I plan on putting the same individual on the wild plate to try and rule out which genotype is incorrect.
June 3, 2014
I went to Manchester today and completed the DNA extraction for both the restoration and the commercial plates. At the end we ran the nanodrop on 2 rows of samples, per plate, to confirm that there is enough DNA and a second elution step wasn't necessary.
Columns 5 and 6 of the restoration plate have a chance of being contaminated because I used the same tips for both rows during one of the steps. Crystal thinks they will probably be okay as there probably wasn't enough DNA on the tip to contaminate the sample, but we will see when the results are finished! :(
May 30, 2014
I came into the lab at 11:30 to remove the samples from the water bath. When I arrived, the water bath was turned off and the temperature was down to room temp (25). I have no idea how long the samples were actually incubated for, but all of the tissue seems to be broken down. There are no visible pieces of tissue, but some of the tubes have some tinting to them (but no cloudiness).
Also, all of the caps had popped off of the tubes during the incubation. The volumes in all of the tubes are even so I think that everything is okay.
The plates are both sitting at 4 degrees.
May 29, 2014
I added proteinase k and buffer ATL to all of the samples (20uL pro k and 180uL ATL to each) and incubated them at 56 degrees C overnight. The incubation started at about 3:30 for the restoration plate and 4:00 for the commercial plate.
I weighed down the plates in the water bath with racks and I kept one rack underneath them to make sure they would not be so deep that any water could get into the tubes.
When I removed the samples from the -20 I was concerned about ~100uL of fluid in the first 16 wells of restoration samples. I asked Steven and he told me to just pipet it out. I later remembered (after looking over my handwritten notes) that I had added 100uL of freshwater to those samples the first day to try to help remove the ethanol. I was planning on adding the water to each, but I forgot for the later cutting days.
..Oops..
May 23, 2014
Before today, I have all of the samples cut except for 3 rows (less than 36 samples). I was planning on completing those this afternoon so they would be ready for lysis on Tuesday, but I cannot find the ethanol that I need to rinse my tools with (maybe it is getting filled?). Sam is currently at the Friedman Lab meeting.
I think if I get the samples done quickly on Tuesday morning, I will still be able to get them incubating before I leave on Tuesday.
May 13, 2014
In the Qiagen protocol, they say that a 2mm x 2mm square of the average animal's tissue is usually about 10-15mg. I am going to cut the tissue to about that size for each sample.
I tried to weigh out a piece of tissue around that size, but since the most exact the scale goes is 0.00g, I can't get a very good idea of my tissue size. The scale kept jumping between 0.00, 0.01, and 0.02g. I think that is probably about as accurate as I will be able to get.
May 12, 2014
I am preparing to cut Oly samples tomorrow. I have set up a work station and have arranged all of the samples in the way that they will be in the plates.
I called Qiagen to see if there are any method modifications for marine mollusks in the DNA extraction protocol. They didn't have any.
Qiagen suggests 20mg of tissue per sample, Brent thinks that might be too much. I will probably use between 10 and 15mg (yet to be decided) of tissue just to be safe.
I am planning on allowing the ethanol to evaporate for the amount of time it takes to complete the plate and then add ~100uL of water to each well to dilute the ethanol further and reduce the risk of completely drying out the samples.
May 9, 2014
First I just want to make sure this anesthetization data is in my notebook somewhere.
Oly anesthesia data.docx
I need to start cutting my samples to prepare them for DNA extraction. I also need to find a way to remove all of the ethanol from them.
I emailed Brian Allen today to see when he might be available to help me collect wild Oly's.
April 22, 2014
I downloaded the protocol for the DNeasy 96 Blood/Tissue kit. (found here)
These are the things that we need to have:
- Centrifuge 4-15C or 4K15C with Plate Rotor 2 x 96
- Ethanol (96-100%)
- Vortex-er
- Multichannel pipet with the extended tips (1250 uL max volume)
- Reagent reservoir
- A way to incubate the samples at 56C
- Something heavy to put on the samples while we incubate them
- Also, RNase A if RNA needs to be digested. I'm not sure if that is important for this or not.
Approximate time to complete 2 plates of samples
Cutting/preparing tissue (I will probably start this ahead of time because I think it could take a while)
Steps 1-4 - 1 day: Step 4 runs overnight (It does say that lysis should be complete in 1-3 hours though with best results overnight)
Steps 5-17 - 1 day
I also went through my current data and looked for potential duplicates in the parent genotypes. This is very subjective as the probabilities are all over the place and none of them match exactly. I think maybe presenting a range will be the best option. For example:
Offspring from each potential offspring with no duplication (exactly as Colony outputs it)-Offspring from each potential parent (deleting potentially duplicated parents)
April 9, 2014
I met with Brent today to talk about early goals and plans for my project.
I am trying to take an inventory of the samples that I have access to that I still need/want to get processed. Unfortunately, I couldn't find any of them, but I have a fairly reasonable count from my notes.
O. lurida that I sampled – The boxes are labeled NOAA- Olympia Oyster I *think* they are wild.
- 60 fidalgo broodstock (at least 1 gill and 1 mantle sample from each)
- 123 Fidalgo seed (total tissue only)
- 33 Dabob broodstock (at least 1 gill and 1 mantle sample from each)
- 83 Dabob seed (total tissue only)
- 14 Case Inlet broodstock (at least 1 gill and 1 mantle sample from each)
- All of this information is stored in a Googledoc.
- After the dropping incident, I went through and checked to see if/how many were lost. We lost 5. The specific samples are labeled in the Googledoc.
I cannot find the PSRF samples that were on a bench in the lab. I looked in the -20 and didn’t see them. I also looked quickly in the -80. I am going to spend more time tomorrow looking through the -80 to find all of these samples!
Also, I looked through Hannah's notebook to see what she sampled (I know she did the other set)
It looks like she sampled 142 commercial olys. I'm not sure where they are stored, but I will contact her to see if she knows.
Hannah sampled 142 commercial O. lurida
She also sampled multiple olys from breeding groups labeld NF, HL, and SN. I’m not sure which of these are for this and what she is using for her project (or if it is either of these)
I got this from her notebook
April 2, 2014
I am working on my proposal today and will upload the draft to Googledocs before I leave at 1:30.
Yesterday, I completed most of the pie charts showing the full siblings, half siblings, and not related individuals within each family for the 2010 microsat data. They are in my shared dropbox:
https://www.dropbox.com/sh/5839mey4mqn2y28/cydXmRe_zd
under "Oly's 2010- Pairwise only" -> "2010 - fullsib/halfsib table".
March 10, 2014
I am running David Stick's Oly data through Colony. I am using the Full-Likelihood parameter.
I am trying to create a matrix out of the output files from Colony using the forwarded matrix from Brent as a guide.
I talked with Steven and Brent today about my Capstone options. I think I am going to do parentage analysis looking at both the data that I currently have and adding to it with the samples that are sitting in the lab waiting to be processed.
I need to think through my timeline and think about getting a proposal together. Also, I need to look into FISH 493 to see if it works with my bus schedule.
I am helping Jake with his Oly anasthesia experiments next Thursday.
February 20, 2014
I have lately been thinking a lot about my capstone. On Friday, Jake sent me multiple reproduction papers to look at. I have started reading them just to get a better idea of possible projects.
Jake suggested looking at the spawn timing of Oly's. Apparently, PSRF has animals that I would be able to use for this.
February 4, 2014
This weekend, I downloaded Colony onto Thomas's computer (since it is Windows). I have been running the 2011 data on it since Saturday afternoon. As of this morning, it was making some pretty good progress. I will post the results on here when they are done!
Tonight, I am going to download "HP-Rare" onto his computer so I can look at the rarefaction curve of this data. I am also working on organizing the south sound data from David Stick so that I can analyze that and compare it to the data I am working on now.
I made a Public Folder in my dropbox where I will keep all of the Microsat data so that there is a live file anyone can look at.
Here is the link:
https://www.dropbox.com/sh/5839mey4mqn2y28/cydXmRe_zd
So far, there are the allele frequencies from David Stick's south sound wild Oly's and another file which will have the GenAlEx relatedness values.
I am working on Excel with this data and doing the same things that I have already done to the restoration grade data. (I will also put this through Colony when I get the other files through).
I also started running the 2010 restoration grade oly data through Colony downstairs in Jake's office.
January 30, 2014
In FSH 207 running Colony. I *think* I am now about 30% of the way through with the 2011 data.
Oly.MidResult5
January 29, 2014
I am in FSH 207 trying to finish the first Colony run.
January 28, 2014
I am working on figuring out Colony today. I have almost successfully gotten through one round. Here are a few things I needed to do to the data in order to get the program to work and just other notes regarding this run:
- I used only the Tandem data for 2011 to start.
- I selected a combination of pairwise/full likelihood. It says that full likelihood is more accurate, but everything I have from before is in pairwise, so I thought it would be good to have both.
- Deleted the headings: Samples, Olur 10, Olur 10, etc.
- Deleted individual 324 which had no data, also I put in 0’s for all of the other loci with no data **Will the 0's effect the values?
- Parent Genotypes, Parent Sibship, and everything related to parents I put 0 since we don’t have any info about the parents.
Currently I am waiting for the program to run (it has been about 30 minutes so far). I will post a file when I get the final data.
I stopped the run at 4:00 which was a little over an hour and a half after I started the run. I will post the intermediate data here.
Also, I named the project "Oly's 2010 & 2011" but it is really just the 2011 data.
Oly.PairwiseHalfSibDyadOly.MidResult6Oly.PairwiseFullSibDyad
January 21, 2014
I updated the olyo "Breeding Group Comparison" page. It is a pretty quick summary of what I am working on, but I wasn't sure how in depth to go with it. Also, seeing as I need to redo all of my data through Colony, I don't really have anything interesting to put on that page except for a little background info.
I emailed Lorenz about Colony. I am going to try to meet with him this week or next to learn at least the basics of Colony. In the mean time, I am planning on trying to install and run Colony on a PC.
January 16, 2014
I didn't get a chance to finish my entry the other day... so here is everything:
I took all of the relatedness values for 2010, 2011, and both years together and took 100 random samples of 20 for the single years and of 100 for the combination. I found the bootmean of all of those random samples. In addition, I averaged the upper and lower 95% confidence intervals.
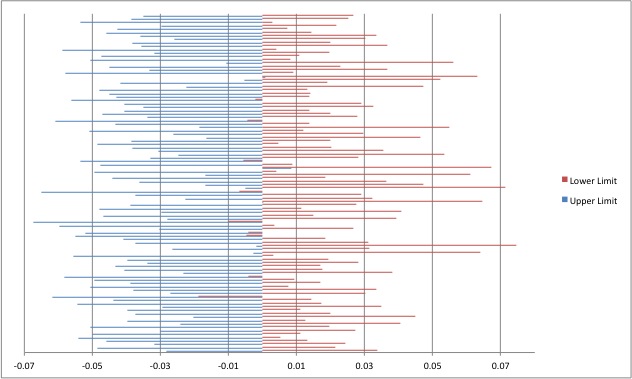
This is a bar graph of ALL of the 95% confidence intervals for the 100 random samples from the 2010/2011 data. It seems to center around 0 pretty well meaning that the animals are not very related.
I took the bootmeans for the total data from each year and the combination. (This is the relatedness between each sample when compared to every other sample)
Graphing the 95% confidence interval for each looks like this: (The red is the upper limit, and the blue is the lower limit)
1 = Both Years
2 = 2010
3 = 2011
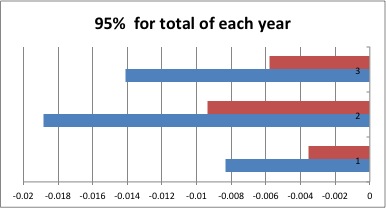
Again, all of the values are negative meaning basically no relatedness between samples.
I took all of the lower confidence limits of the random samples and sorted them numerically. I then counted all of the positive values. Since there are 100 random samples, I can easily just convert that into a percent. I can use this as a p-value to describe, how much confidence we have that a random sample will have less than 0 relatedness. ( I may be completely describing this wrong)
P-values:
2010 & 2011: 0.03
2010: 0.01
2011: 0.02
What I took from this: we have a high degree of confidence that a random sample of these oysters would not be related.
There are a lot more graphs that I have made (mostly describing the same things from 2010, 2011, and both years together) If you have any questions or want to see them let me know!
Also, there is one more graph that I am still working on. I can't get the error bars right. From what I keep getting, there error bars are GIANT which I don't think is right? I'll keep working on it.
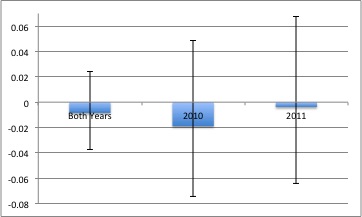
This is the grand mean from each year with error bars. The error bars are the (average upper CL - the grand mean) and the (grand mean - the average lower CL).
Also, I worked on the Relaxation paper this morning on the bus. It still has a lot of work before I send it to anyone for proofreading, but I'll keep you updated.
January 9, 2014
Here is what I have gotten so far with the microsat data.
First, a table with each family and the average relatedness between each member of that family. Note: we did NOT send in all of the samples we had so this is just a subset of what we have which is a subset of each actual family.
| Year |
Family |
Average Relatedness |
Total sampled/analyzed |
Original Family Label |
Estimated Total Alive |
| 2010 |
1 |
0.2785 |
4 |
2 |
10 |
| 2010 |
2 |
0.0818 |
10 |
5 |
550 |
| 2010 |
3 |
0.0702 |
10 |
14 |
450 |
| 2010 |
4 |
0.0787 |
10 |
16 |
30 |
| 2010 |
5 |
0.1865 |
10 |
17 |
100 |
| 2010 |
6 |
0.2331 |
10 |
18 |
100 |
| 2010 |
7 |
0.1846 |
10 |
19 |
725 |
| 2010 |
8 |
0.1902 |
4 |
22 |
5 |
| 2010 |
9 |
0.2477 |
10 |
23 |
425 |
| 2010 |
10 |
0.0983 |
10 |
24 |
600 |
| 2011 |
1 |
0.0918 |
10 |
11x5.002 |
25 |
| 2011 |
2 |
0.0901 |
10 |
11x5.007 |
25 |
| 2011 |
3 |
0.2375 |
10 |
11x5.011 |
400 |
| 2011 |
4 |
0.3282 |
10 |
11x5.013 |
10 |
| 2011 |
5 |
0.227 |
10 |
11x5.014 |
300 |
| 2011 |
6 |
0.0497 |
10 |
11x5.015 |
400 |
| 2011 |
7 |
0.2308 |
9 |
11x5.018 |
10 |
| 2011 |
8 |
0.3319 |
10 |
11x5.019 |
400 |
| 2011 |
9 |
0.1144 |
10 |
11x5.022 |
650 |
| 2011 |
10 |
0.2133 |
10 |
11x5.024 |
24 |
I took these relatedness values and the grand mean from the random samples (which I will describe later) and put them into a scatter plot.
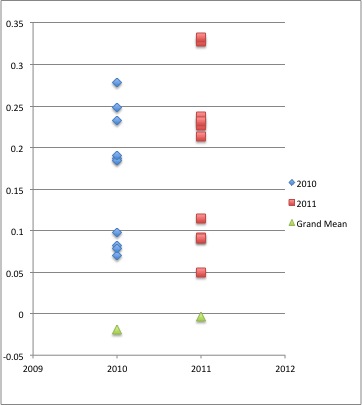
(Please excuse the random years on the X-axis. I can't figure out how to remove them from the graph while keeping the data fairly centered on the plot.)
December 12, 2013
I met with Brent today to learn more about analyzing the Microsat data. He showed me how to use the "BootMean" equation from PopTools to find the 95% confidence intervals. My plan is to do the following:
- Use Poptools to sample 20 of the relatedness values 100 times and find the confidence interval for each and compare them for each year individually.
- Use Poptools to sample 100 of the relatedness values 100 times and find the confidence interval for each of them those and compare them. (This is for when both years are together)
- To find the confidence intervals of the average relatedness between a family when compared to the average relatedness between all of the other families. (Also to compare the two years here)
- Figure out how to make the bar graphs look nice from excel.
- Look into trying this with Colony again and see if the values are the same
- Look into using R for this. (Maybe it will be better?)
- Since each years samples are all ready technically a random sample I should also just look at the bootmean for the total values for each year.
Using BootMean:
- Select the 6 cells where the output should go
- "=BootMean("
- Select all of the input values (Use Ctrl+Shift+Down to select the whole column)
- Press Ctrl+Shift+Enter
- The middle two values are the ones that I need.
October 17, 2013
Learning Tandem and attempting to learn ColonyTandem files for the Oly microsat data: 2011__only_excel_tandem.txt2010_only_excel_tandem.txt
I split the broodstock and progeny into separate files. Also, I had to leave two columns and two rows empty in order to get all of the data points rounded. (column/row 2 & 3 were blank)
Colony: I downloaded the program and I am using it on R. I am just practicing with our data, but when I can actually get through all of the steps (without errors) I am going to do it again with practice data to make sure I am doing everything right.
I need to use tandem files with any of the samples that had missing data deleted.
2011 -- Samples 374, 324, and 388 were not used.
2010 -- Samples 104, 48, 49, 51, 357, 363, 176, 182, 183, 264, and 119 were not used
--I finally got through all of the steps, but my results file is blank...
I am going to try to get the example data to work next.
June 24, 2013
Data/notes from 6-18
4 degree treatment - Families labeled "NF"
- 10 removed from ambient water at 2:15, in ice water at 2:20
- Group HJ 57 removed from ambient water at 2:03 in ice water at 2:38
- After (I think) 30 minutes oysters were removed and placed into individual beakers in ambient water. We watched to see if any larvae were released. We didn't see any.
- At 3:02 5 were removed and placed at 20 degrees C.
- We replaced the Oly's into their family bags and put them back into their original buckets. The runoff was being collected and we asked that it be checked over the next few days in case the oysters aborted the larvae later. There didn't seem to be any significant increase in larvae that were released from these families compared to the control group.
85 g/L MgSO4 treatment
- Out of water at 2:03
- In treatment at 2:34
| Number |
Group |
Treatment |
|
| 1 |
15 |
HJ56 |
Anesthesia + removal + Shuck |
| 2 |
15 |
HJ56 |
Anesthesia + removal |
| 3 |
17 |
HJ58 |
Anesthesia |
| 4 |
13 |
HJ58 |
Control |
- Samples were saved only from Treatment 1. Each oyster that something was removed from was given a letter. Sample removed before shuck was "1" and after was "2". 9 oysters gave us some type of sample.
- Treatment 2. We squirted water into each oyster and visually decided if anything was removed. 11/14 had something removed. (1 wasn't relaxed).
Notes from 6-20
I identified and counted (if applicable) the material that we saved from the oysters on 6-18.
On 6-19 Brent added ethanol to the samples in order to preserve them better.
All vials (even the ones with nothing) had a milky layer in the middle of the fluid. Did some material precipitate out? Did any material rupture?
Vial A - Sperm (We identified this at the hatchery)
Vial B1 - Nothing
B2 - Nothing
C1 - 14.5 mL - Nothing
C2 - 14.5 mL - Nothing
D1 - 27 mL - Sperm
E1 - 12 mL - Sperm
E2 - 34.5 mL - Sperm
F1 - 32.5 mL - Nothing
G1 - 22.5 mL - Larvae
- 296 larvae in 100uL
- 169 larvae in 33.3uL
- 108 larvae in 33.3uL
- 123 larvae in 33.3uL
- ~3740 Larvae/mL
- ~84,150 Larvae total
- 182 larvae in 100uL
- 214 larvae in 100uL
- 235 larvae in 100uL
- ~2103 Larvae/mL
- ~25,240 Larvae total
H1 -27mL - Sperm
I1 - 26 mL - Nothing
I2 - 17.5 mL - Nothing
We got about 76.92% of the larvae from rinsing alone in oyster G.
June 18, 2013
Some notes about the set up from 5-14 vs 4-11.
- On 4-11 there was ~10 degree temperature increase vs 1 degree increase on 5-14
- On 4-11 the containers were on the lab bench and we were able to look at the oysters eye level to see if they were open. On 5-14, the table had about a 6 inch lip that the containers were behind. This may have contributed to some error because we only had a top down view. When the Oly's only open ~2mm, it can be hard to tell if they are open or not from that angle.
- On 5-14 the table had about 1/2 inch water on the bottom.
- For all experiments the selection of oysters for each treatment was completely random. We had a bunch of oysters and we would randomly distribute them between treatments. Ex. 1 handful of oysters: 1 in container 1, 1 in container 2, etc.
Mortalities from 5-14.
One oyster from each concentration died. (One from control, 75, 85, and 100 g/L).
There were a few more mortalities on 6-17. I did not record which groups they came from and we told Ryan he can stop checking them on 6-18.
May 31, 2013
Here is my protocol and results from the Olympia relaxation experiment.
4-11-13.xlsx05-14-13.xlsxProtocol with edits.docx
Monday morning (6/3) I will be completing a run with varying lengths of oxygen exposure and (probably) 85g/L for the concentration.
I still need to run some more analysis on the current data.
March 15, 2013
The Budd Inlet case study samples have been organized and the families we are sampling have been separated.
March 8, 2013
Oly Relaxation Experimental DesignTest groups
- Concentration (MgSO4)
- 0 g/L
- 25 g/L
- 50 g/L
- 75 g/L
- Temperature
- 11°C
- 18°C
- 11 -> 18°C
- 18 -> 11°C
- (Or whatever cold/warm temperatures are available)
- Food
- Food
- No Food
I will start first with concentration. The most successful concentration will be used for the temperature tests and so on for food. Is this an okay method? I would prefer to not have 32 test groups of 10 oysters each if I can help it. That just sounds like a bit much...
Duration will be measured too. But not in quite the same way as the other groups. I will just check the oysters every 30 minutes (for example) for x amount of hours. We will get an idea from that how quickly it works and if concentration affects the speed of relaxation.
We could measure duration for recovery too.
Population size: 10 oysters for each.
- 10 oysters will be safe. Five gives definitely less significant data if we get middle of the road numbers (aka 3 open and 2 closed)
Is it important to have an actual test with MgCl2 or will it be enough to just state that we tried it in preliminary testing with mediocre results?
I will be using an equal ratio of freshwater/saltwater to control for salinity.
Oysters will be considered relaxed when they are tapped and taken out of the water without closing.
The oysters will be watched for an amount of time afterwards also to check for longer term survivorship.
March 7, 2013
All of the Oly's have been sampled and their vials recorded in the Googledoc. The tanks have all been cleaned and are stacked in the cold (or not so cold now) room on the top shelf.
February 12, 2013
Last week, Box D of the NOAA samples fell and broke. I counted 5 lost samples, but they are all back in the order that they were in originally.
February 7, 2013
I am continuing work today with relaxing the oysters.
- There are 3 oysters in 50g/L MgSO4
- There are 5 oysters in 70g/L MgCl2
After 30 minutes, 1 oyster was semi-relaxed in MgSO4, It would stay open after being touched and handled underwater, but when I took it out of the water it would close instantly. I don't know if that has to do with the mass of the shell or if it was not completely relaxed yet. I left it in the water for another hour and was in the same state at that time. I took it out and put it into the fresh water.
At the hour and a half checkpoint, 1 other MgSO4 and 1 MgCl2 were also in that "semi-relaxed" state.
At two hours, I removed all of the oysters and put them into clean saltwater.
MgSO4 oysters are all labeled with red nail polish, MgCl2 are unlabeled.
Also, the oysters from last week were labeled and put back into FSH 008.
January 29, 2013
I put 5 Olympia's from Case Inlet (being stored in FSH 008) in MgSO4 today. I used 1L of water (50% fresh, 50% salt) and 70.14g MgSO4 at 18 degrees.
After 1 hour, 3 were relaxed. At hour 2, the other 2 were relaxed. I checked once per hour.
After I noticed that they were relaxed, I put them into clean saltwater (also at 18 degrees). Within 1 hour of recovery time, 3 had closed. The other 2 closed after 2 hours.
I will be leaving them in the container they are currently in with the fresh water with some food in the cold room in MAR. I think this will be the easiest way to monitor them for the next few days. Otherwise they will be in the aquarium room in FSH and in a bag with the other Olys. I can mark them with nail polish before putting them back in FSH.
The last of the Fidalgo Seed were sampled today. They are in the -80 freezer in Box D.
January 24, 2013
We now have 10 samples from each of the broodstock population most of them have 3 samples each (1 gill, 2 mantle).
The Dabob population is much smaller than the other two. I'm a little worried some of the samples don't have enough tissue. Definitely between the two mantle vials there should be enough though. Sam pointed out that two of them looked like they might be Pacifics. I took pictures of the shell and insides of one of them. I'm sure someone can identify them. There are also notes about which vials their tissues are in in the "Olympia Oyster Samples - 2012" Google doc.
January 22, 2013
| pH |
Ammonia (ppm) |
Nitrite (ppm) |
Nitrate (ppm) |
Temperature (C) |
| 7.8 |
0 |
0 |
10 |
11 |
January 18, 2013
I was planning on sampling today as well as trying to relax some Oly's. Unfortunately, I completely lost track of time and now I only have an hour and a half in the lab today (oops..). So I am going to just write up a small experimental design for Tuesday's relaxing trials and label tubes for next week.
- 1. If I can find the materials, I would like to run 2 treatment groups. (3 oysters in each)
- MgSO4 in FSH 008
- MgSO4 in the regular cold room
- For MgSO4 I will be following the protocol sent from Taylor Shellfish. (7% w/v) with a 1:1 ratio of saltwater and freshwater.
- If I can get set up quickly, they should be exposed for up to 4 hours. I will check them periodically starting after ~2 hours. Water temperature will be taken.
- If any are anesthetized, I will take note and measure how much they are open as well as taking measurements of their width and length.
- After this I will put them back into the clean saltwater.
- After 4 hours, any closed oysters will be put back into the clean saltwater in FSH 008.
Other things to possibly try testing in the future, put some food in the water they are being treated with and see if this quickens reaction time.
January 15, 2013
| pH |
Ammonia (ppm) |
Nitrite (ppm) |
Nitrate (ppm) |
| 7.8 |
0 |
0 |
10 |
January 10, 2013
14 Oly's from Case Inlet were sampled. (2 mantle and 1 gill tissue sample from each) They are stored in the -80 freezer in box "C". See Googledoc for vial labels and measurements.
January 8, 2013
| pH |
Ammonia (ppm) |
Nitrite (ppm) |
Nitrate (ppm)c |
Temperature (C) |
| 7.8 |
0 |
0 |
10 |
11 |
December 17, 2012
| pH |
Ammonia (ppm) |
Nitrite (ppm) |
Nitrate (ppm) |
Temperature (C) |
| 7.8 |
0 |
0 |
5 |
10.5 |
I also finished getting the first 90 samples from the Fidalgo Seed (from Tank 4). There is barely any tissue from many of them (because they are so small). The shell measurements and vial numbers are in the Google doc. The average size is probably about 5mm by 4mm.
The Pacific Oysters that we sampled from are still alive.
December 10, 2012
| pH |
Ammonia (ppm) |
Nitrite (ppm) |
Nitrate (ppm) |
Temperature (C) |
| 7.8 |
0 |
0 |
5 |
11 |
Also, I checked on the the sampled oysters from Friday. One was open and it shut when I tapped on it (Red), the other two were shut.
December 7, 2012
Oysters were sampled at ~11:30. They seem to be just as responsive as yesterday. I took mantle samples from each and marked the shell with nail polish.
| Sample |
Color |
| PAC_001 |
Pink |
| PAC_002 |
Red |
| PAC_003 |
Purple |
December 6, 2012
At 9:30 I put 3 Pacifics in a liter of water with 50.013g of MgCl2.
They were checked after both 4 and 5.5 hours. Each time, they were open but seemed to close some after being handled.
They are being left in the solution overnight. Maybe tomorrow they will be less responsive.
Paper this is modeled after
December 3, 2012
| pH |
Ammonia (ppm) |
Nitrite (ppm) |
Nitrate (ppm) |
Temperature (C) |
| 7.8 |
0 |
0.25 |
10 |
11 |
November 28, 2012
I changed the water today
| pH |
Ammonia (ppm) |
Nitrite (ppm) |
Nitrate (ppm) |
Temperature (C) |
| 7.8 |
0 |
0 |
5 |
11 |
Also, all of the historical data is entered.
November 27, 2012
| pH |
Ammonia (ppm) |
Nitrite (ppm) |
Nitrate (ppm) |
Temperature (C) |
| 8.2 |
0 |
0.25 |
15 |
11 |
The oysters that we tested last week are still alive. When tapped, they close at approximately the same speed as the other oysters from the tank. It seems that they have fully recovered and seem unaffected.
November 21, 2012
| pH |
ammonia (ppm) |
nitrite (ppm) |
nitrate (ppm) |
Temperature (C) |
|
| Old |
8.2 |
0 |
0.25 |
20 |
|
| New |
7.8 |
0 |
0 |
5 |
11 |
I got an email yesterday about the historical data information. I will work on entering the info into the Google doc. Here is the file that I received:
Historical data from DoE.xlsx
Water was changed today. We took one tank out of the system.
We got some bio-balls from the Friedman lab and added them to our system. (Probably about 25)
November 20, 2012
When I went into the cooler, all three of the oysters that I used yesterday were feeding (cracked open a little) I tapped them lightly with the thermometer and they all closed. So far they seem to have recovered. I will continue to monitor them. I would like to compare their response to one of the others that is free from the bag. Unfortunately, neither of those were open today.
The temperature of the water was a chilly 8 degrees. This is a different thermometer than I have used in the past (because I broke the original) so I have no way of knowing if this is a difference in thermometer calibration or actual water temperature.
I did not test water quality. I will test this water tomorrow along with the new water as we are doing a water change.
November 19, 2012
Today I am finally trying to anesthetize the oysters.
Deviations from method:
- I used 3 liters of seawater and 150.24g MgCl2.
- I chose oysters that were approximately the same size. I will be taking their mass, height, and width after they are anesthetized or after 6 hours.
- The oysters were put into the water at 10:15 AM.
- I took water from the trash cans.
Oysters were removed at 3:30 PM. All three of them have opened up (probably about 1/2 inch or so). We put them back into the regular tank. Over the next few days we will see if they recover and how they act compared to the other, untreated oysters.
I finished sampling the Dabob progeny. All samples are in the -80 freezer either in Box A or B. Notes, sizes, and specific vial numbers are all recorded in the Google doc.
November 16, 2012
Re-measured nitrate level today. It is still at 10ppm.
For the experiment I wrote about yesterday. I assumed 5 liters will be enough water because it is the size that they used in the experiment I read. I think we can maybe use a smaller volume if we do not have enough MgCl2 for 5L. I will see on Monday though. I do not know how much water 3 oysters need for 6 hours. (I would be very surprised if they actually need 5L)
November 15, 2012
I am planning the experiment for anesthetizing the oysters. The experiment that I am modeling mine after is at "http://archimer.ifremer.fr/doc/2009/publication-6352.pdf".
Purpose: To anesthetize Pacific Oysters in order to non-lethally sample them.
Materials:
5L seawater
250 g MgCl2
3 Pacific Oysters
Method:
- 50 g/L concentration of MgCl2 in 5L of seawater
- After starving the oysters for 2 days, I will place them in the MgCl2 solution.
- I will leave them in the solution for 6 hours.
- After taking them out, I will assess to see if they are completely anesthetized or not. This will be done by gently tapping on their shell.
- Two of the oysters will be sampled. * I don’t know if we actually want to sample them this day or not * One will be used as a control.
- The oysters will be returned to clean seawater.
- In the following days, I will check to make sure the oysters are still alive and if they have recovered.
For the two being sampled, I thought we could try taking either different amounts or different types of tissues. Just to see how they do.
In general, a larger sample size would probably be preferred, although, I do not know if we want to risk losing too many on the first go!
November 14, 2012
I checked for dead oysters today. There are not any. I don't have time to finish sampling the Dabob progeny today. I will hopefully be able to finish them tomorrow.
I am still interesting in anesthetizing the Pacific Oysters. I think maybe I will try it on Monday. I will definitely have time then. Also, they will not have eaten over the weekend. Until then, I think I will continue researching the topic to make sure I have the most accurate information I can find.
November 13, 2012
I did a water quality check today.
| pH |
Ammonia (ppm) |
Nitrite (ppm) |
Nitrate (ppm) |
Temperature (C) |
| 8.2 |
0 |
0.25 |
10 |
13 |
I sampled 28 more oysters from the Dabob Progeny. I also entered all of the data from today and Friday into the Google doc.
November 9, 2012
I checked for dead oysters today. I found 1 in tank 4 in the Dabob Progeny. It is so small I could not tell if there was tissue or not. When I brought it up to sample, I found that it was just full of mud. I recorded its measurements.
I added some sodium bicarbonate today to try to raise the pH a little bit.
I started sampling the Dabob Progeny from Tank 4. I got all of the vial's labeled, and 30 samples. For these, there is only one sample per oyster, because I am just putting all of the tissue into the vial.
November 8, 2012
I did a decent amount of research on anesthetizing the oysters. Any useful information I posted in a new spreadsheet in Google docs called "Anesthetizing Research" with links to the document. I will continue to look for some more information.
I checked the water quality in the tanks, the cans, and the bucket of old water.
| pH |
Ammonia (ppm) |
Nitrite (ppm) |
Nitrate (ppm) |
Temperature (Celsius) |
|
| Old |
8.2 |
0 |
1.0 |
20 |
13 |
| Tanks |
7.8 |
0 |
0.25 |
5 |
13 |
| Cans |
7.8 |
0 |
0 |
0 |
13 |
November 7, 2012
We changed out the water today. Unfortunately, I don't have time to check the water quality of the new water. I will do it first thing tomorrow!
November 6, 2012
Today is Water-quality-check-day!
| pH |
Ammonia (ppm) |
Nitrite (ppm) |
Nitrate (ppm) |
Temperature (Celsius) |
| 8.2 |
0 |
1.0 |
20 |
13 |
I noticed one dead oyster in tank 2. It was an empty shell, and it was attached to one alive one. I decided not to remove it from the bag since we cannot get samples from it anyway.
November 5, 2012
Today the water temperature is the lowest that I have seen it before. At 13 degrees I feel that it is probably still an appropriate temperature, but I will keep watching it to see if there continues to be change. I found one dead oyster in tank 2 (Case Inlet).
After looking at this, I have realized that I'm not sure whether tank 2 is broodstock or progeny, also there is only one bag with a label from the south sound. Judging by the size, I'm pretty sure that these are broodstock. But I should probably ask where the progeny are. I know there should be one of each age group from each location.
All else seems to be well.
November 1, 2012
Yesterday afternoon, Sam added ~200 mL of sodium bicarbonate to the system. Today the pH level is 8.0 (much better!)I just fed the oysters and took the temperature. It was 15 degrees. This is probably near the maximum acceptable temperature. I did not find any more dead oysters with tissue. Only one empty shell in tank 3 (Fidalgo broodstock). I still removed the shell from the bag so that we can more easily account for it and take it out when we sample again later.
Yesterday, I got an email from someone at the Department of Ecology about my request for the data that wasn't readily available on the website. I also asked if they could point me in the right direction of some more recent data for Dabob Bay. The only data that I can request is from ~1973-1988. Hopefully I will get some results soon.
October 31, 2012
I retested the pH. It jumped up to 7.8 now. I'm not sure if the test is just inaccurate or if there are further problems with the water or CO2 content.
We took samples from 11 oysters today from the Fidalgo Broodstock. One sample from the gills and one from the mantle in each oyster. They are currently in the freezer in a box labeled "NOAA - Olympia Oysters Box A". I made a spreadsheet with all of the information including: vial label, height, width, and which group the oyster is from.
The notation that was decided for the samples is : Location_ Oyster Number_Gills or mantle. For example, The mantle from the 3rd oyster from Fidalgo Bay would be: FID_003_M. The oyster number will be unique only to location.
October 30, 3012
Today I finished entering, organizing, and graphing the historical data that we currently have for all of the sites. This will continue to be a work in progress, though, until I can find more information.
I also finished the Oly Oyster Project Participants spreadsheet.
It is Tuesday so today is water quality check day. Today's results are:
| pH |
Ammonia (ppm) |
Nitrate (ppm) |
Nitrite (ppm) |
Temperature (C) |
| 7.4 |
0 |
10 |
1 |
14 |
I checked the bags for dead oysters again today. Any that I found today I took out and placed near the bag. Hopefully they are ready to be sampled.
In tank 1, there was 1 oyster.
In tank 2, I could not find the oysters that I recorded as dead yesterday. Either I made a mistake yesterday, or they are just blending in.
In tank 3, I found 3 that are dead in the unmarked bag. One of the dead ones seems to be attached to either one or two others which are still alive.
October 29, 2012
I inspected the oysters more closely to look for any more dead ones. I found 3 (two in tank 2, and one in tank 1). I just left them in the bags, I wasn't sure if I needed to do anything specific with them. Other than that though, it was a quick visit. I am still trying to finish up putting the graphs of the historical data up. Hopefully I will be finished with that tomorrow.
October 26, 2012
Today I spent the majority of my time editing and organizing the historical data for the sights. I will need to submit a request for all of the possible historical data from Dabob Bay from the Department of Ecology. UW Oceanography has some (06/2006 - current) as I noted in a previous post. The problem is, all of that data is presented in graphs. I need to see if I can find the raw data.I took some pictures of the other organisms I have found in the tanks.
| I believe these are small Blue Mussels |
| Here, you can see the byssal threads |
| These may be Japanese Little Necks |
There are also many oysters covered in barnacles, both living and dead.
October 25, 2012
Today I finished counting the oysters. I have one count now for each tank and bag. I will probably recount them soon just to make sure that my first counts are accurate. Also, I will need to be making sure they are still alive.
I retested the ammonia level today, it was higher than it should be on Tuesday. The new result is 0 ppm, which is optimal.
I spent quite a lot of time researching the sites' historical data and trying to organize it. I am still in the process of putting it into the google doc. The different sites have drastically different amounts of data and I am going to continue to try to complete these records. For data between 1973 and 1990, I will have to put in a request to the state's Department of Ecology.
For the data, there were multiple points that read -9999 (mostly at the deepest level measured). I just deleted those out of the spreadsheet; I am trying to make the spreadsheet as organized as possible. Also, when the information was downloaded, it was organized by date. I reorganized it now: it is by height and then date within that.
October 24, 2012
Today I had a pretty quick visit. I spent time counting some of the oysters. I decided it was easier and more accurate to just take them out of the bags to count them. While I was trying to recount the progeny in Tank 4, I found a marine worm. From what I could tell, it was exiting one of the shells. I took a picture of it. It is probably harmless, but I was worried it might be a predator to them. I will work on identifying it tomorrow. Also, there seem to be multiple tiny mussels in Tank 4 as well. I will try to take a picture of one tomorrow. I think it may useful to take note on any extra species living in the tanks.
October 23, 2012
Today was my first day in the lab! (Which I think was pretty great, by the way) I was trying to figure out and get used to my duties. Here are the main things I accomplished:
1. I tested the water quality in all of the tanks. All of the numbers looked pretty good. The nitrate level was a little bit higher than it should be; although the pamphlet says that it will take 4-6 weeks to establish the natural bacteria system that controls many of the chemicals. I also tested each of the five tanks separately, I'm not sure if that is necessary. Every result came out the same for each tank, which makes sense since the water circulates between them. I will likely ask about this tomorrow.
2. I had an initial attempt at counting some of the oysters. This is really difficult since they are in bags and difficult to lay out flat. Especially counting the tiny progeny in tank 4, many of them were connected to each other. It is also difficult for me to tell if there is just a broken shell or a living oyster. I think I will get better at this over time, though. My current plan with this is to try counting them every day for a week and taking an average until I can find a better system. Out of the oysters that I saw, all of them were alive. Also, I could see some of them open up to feed after I put the algae in the tank, which is a good thing.
3. I set up a google doc to organize and share the information that I'm getting.
4. I started to look up the information from the sites the oysters are from. It is pretty easy to find real-time data from the sites, but historical seems to need a little bit more digging. I have spent the most time looking for Dabob Bay, and the earliest data, that I have found so far, from both UW Oceanography and NOAA is June of 2010. That is when they put the buoy out. I'm not too sure how "historical" two year old data is for this project. I'm planning on working on this more later in the week. Also, from what I saw today, only Dabob Bay has a buoy set up in it, the other sites' information may need to be taken from areas that are in a close proximity.
| Tank |
pH |
Ammonia (ppm) |
Nitrite (ppm) |
Nitrate (ppm) |
| 1 |
7.8 |
0.5 |
0 |
0.25 |
| 2 |
7.8 |
0.5 |
0 |
0.25 |
| 3 |
7.8 |
0.5 |
0 |
0.25 |
| 4 |
7.8 |
0.5 |
0 |
0.25 |
| 5 |
7.8 |
0.5 |
0 |
0.25 |